
April 30th, 2014
Thinking About Risk
John E Brush, MD
The new ASCVD risk and lipid guidelines created quite a stir. People have questioned the accuracy of the risk calculator and the wisdom of giving statins to people above the 7.5% 10-year risk threshold. We have had a very robust and good discussion. But I have been wondering about how our patients will perceive their risk. Will they truly understand what we mean when we give them an estimate of their 10-year risk? It is conceptually easy to talk about an LDL target, but it is much harder to understand one’s 10-year risk of a cardiovascular event. The difficulty of wrapping one’s head around the concept of risk may be part of what is driving the controversy over the risk guidelines.
One way to visualize the idea of individual risk is to use an image of a roulette wheel. Imagine that each of us has one spin of our own roulette wheel and that spin will determine our 10-year cardiovascular outcome. We can change the design of our own roulette wheel to reflect our own 10-year cardiovascular risk.
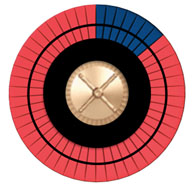
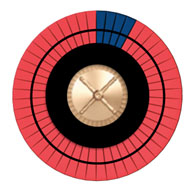
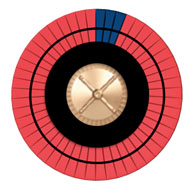
Imagine a wheel with 50 spaces, some dark, representing bad outcomes, and the others red, representing good outcomes. Increasing the risk increases the number of dark spaces. If we stop smoking, we can reduce the number of dark spaces by roughly half. If we start a statin, we can reduce the number of dark spaces by about 20%.
Figure A shows the roulette wheel for a 59-year-old African-American man with a total cholesterol of 220, HDL of 40, with untreated systolic blood pressure of 120, without diabetes, who smokes. The 10-year ASCVD risk is around 13%. If he stops smoking, his risk drops to 8%, as shown in Figure B. With statin treatment, the risk drops further to about 6%, as shown in Figure C. The roulette wheels give a visual demonstration of the absolute and relative risks. If you had just one spin of the wheel, which wheel would you prefer to use? Are you willing to take a statin for 10 years to go from the wheel in Figure B to the one in Figure C?
Figure A Figure B Figure C
Risk is another word for probability, something that isn’t always easy for people to think about. Some consider it to be the observed frequency of an outcome, measured repeatedly over the long-run. Pictorial displays of little icons can visually show this notion of probability, but they don’t display what is really going on with the risk calculator. Others use a Bayesian or subjective notion, where probability is one’s degree of belief that a particular outcome will occur. A third example is to view probability from a design point of view. How we design a roulette wheel, a coin, a die, or a lottery can determine the frequency of events over the long-run, or our degree of belief about the outcome for a single individual. We can design our own roulette wheel through risk factor modification. As the saying goes, we can make our own luck.
The roulette wheel analogy may help us wrap our heads around the concept of individual risk and explain this concept to our patients. To read more about risk, I highly recommend a new book called Risk Savvy: How To Make Good Decisions by Gerd Gigerenzer.
How do you think about risk?
Just a note that John Brush’s terrific book – the Science of the Art of Medicine – has rec’d a terrific review from Richard Lehman in Circ Outcomes. Here is the link. http://circoutcomes.ahajournals.org/content/early/2014/04/29/CIRCOUTCOMES.114.000860.full.pdf+html
The book is free on iTunes. I highly recommend it.
I signed in to comment on Dr. Brush’s excellent book and found that Dr. Krumholz has done so already. It is a beautifully written, clinically pertinent, and free book that would be especially helpful to students, trainees, and all medical providers that make daily medical care decisions.
There is a tool that helps clinicians and patients have a discussion around risk, in particular related to 10 year CV risk and the use of statins to reduce that risk. This tool has been tested in randomized trials and found effective and is currently being implemented in practices to determine its effectiveness and ability to normalize in these settings. The tool is also available free of charge here: http://statindecisionaid.mayoclinic.org and is designed for use during the clinical encounter.
Victor,
I think your decision aid is excellent. It is very intuitive and easy for patients. Your work on decision aids and shared decision making over the years has been tremendously important.
I tried to create a visual explanation that mimics what the risk calculator actually does. As you well know, the risk calculator doesn’t go back into the pooled cohorts to find 100 people just like the patient whose risk is being calculated. The pooled cohorts only had 1647 black men, and there were probably very few people who exactly matched the description that I gave in my example. Rather, the investigators use the cohorts to derive beta coefficients that are used to calculate the risk. The beta coefficients give a measure of how risk increases for each unit increase in each covariant and this method enables to calculator to interpolate through data sparse segments in the cohort. Thus, the calculator gives calculated risk, not an observed frequency of risk.
I like the roulette wheel analogy because the design of the roulette wheel demonstrates propensity, as well as the play of chance. It also makes it obvious that for a single individual there is only one chance to make a choice (one spin of the wheel). Seems harsh, but that’s the grim reality. The choice and baseline risk determine the design of the roulette wheel that will determine the outcome.
I present this as food for thought. It would be interesting to test whether patients easily understand a roulette wheel decision aid. In the meantime, I will continue to use your excellent resources for decision aids. Thanks.
Another book I read recently that focused on how to understand probabilistic risk prediction in a variety of disciplines is “The Signal and the Noise”, by the statistician and blogger, Nate Silver (http://www.amazon.com/The-Signal-Noise-Many-Predictions/dp/159420411X). I especially liked one of his points at the beginning, where he reminds us that although the words predict and forecast have similarly meanings in modern English, historically they had very different connotations. The word predict comes from Latin, and has connotations for “fatalism, fortune-telling, and superstition”. The word forecast, meanwhile, is Germanic in origin. “Making a forecast typically implied planning under conditions of uncertainty”, Silver tells us: “It suggested having prudence, wisdom, and industriousness, more like the way we now use the word foresight.” I think this is a good reminder of how we should approach the concept of risk in medicine as well (e.g., in a Bayesian manner, which Silver is a proponent of).
Dr. Brush’s roulette wheel also reminded me of the recently released Senate election simulator in the New York Time’s website (http://www.nytimes.com/newsgraphics/2014/senate-model/). Towards the bottom, the reader has the option to “spin the wheels”, so to speak, to get an understanding of the probabilistic nature of election forecasting—which I thought was a fascinating and intuitive way to illustrate this concept. As we continue to iterate our EHRs and it becomes a routine aspect of clinical encounters, there should also be opportunities to apply insights from fields such as data-driven journalism to improve how we communicate probabilistic risk to patients, building on the principles such as those elucidated by Dr. Montori’s work.