
February 13th, 2012
Pop Quiz
Shengshou Hu, M.D.
To celebrate Heart Month, CardioExchange welcomes this fun bit of trivia from Dr. Westby Fisher, an electrophysiologist practicing at NorthShore University HealthSystem in Evanston, Illinois, and a Clinical Associate Professor of Medicine at University of Chicago’s Pritzker School of Medicine. This piece originally appeared on his blog, Dr. Wes.
What does this graph represent?
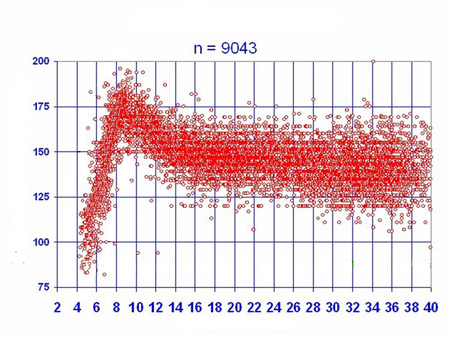
Hint: you were probably on it.
Scroll down for the answer.
The x axis is weeks (of gestation), the y axis is heart rate. The rest of the answer can be found here.
I thought this was interesting because of the remarkably linear relationship of the heart rate to gestational age in the first trimester of pregnancy.
Happy Heart Month!